
Each day prior to market open every member of our trading team creates a sheet comprised of 4 main sections which we we work directly from during the trading session. These sheets contain everything we need to know to execute the plan for the day. They are also uploaded each day on the blog in the posts titled Pre-Market Commentary. For many of you they may be self explanatory, but for those new to us what follows is an explanation of each section in detail…
Commentary Section:
-This may be the most important part of the sheet and actually the impetus for this blog. We find that writing down trade ideas, instincts, gut feelings, etc. REALLY helps solidify the trading plan for the session. Furthermore, the simple act of knowing that others will read it forces you to consider what you write more carefully. I can’t stress enough how much this has improved our trading and I suggest you all start doing it. You can then compare what you write to what we write and if it tends to be the same day after day it can be a real confidence builder for those lacking in that department.
-Whether you pick up ours at the end of the day, or you happen to be one of the pre-market members, you will notice that the important clues about which levels are more or less likely to hold, where we will procede with extra caution, and overall macro pressures interacting with some of the levels end up being what determines success or failure on most of the trades. Remember, trading is gambling and you are simply choosing one side of a binary proposition – like a coin flip. If you take out costs of trading you are left with a default even money proposition. What determines consistent success is your edge. Your edge comes from the way you interpret what is more or less likely to occur at a level along with analysis of order right at the actual moment of trading.
-The levels we are providing ARE where the most contention between buyers and sellers is likely to be. They come from actual trading and they don’t lie like indicators all trying to predict future behavior using time based analysis of the past. There is no time basis to our levels. Just how much traded at that price the last time the market was there. But this is also why we keep saying that our trading methodology isn’t a system and you have to stop trying to turn everything into one. Our trading works BECAUSE it isn’t a system. Here is an example: Let’s say 1178 is an interim high and also the daily R1 and an acceptance and rejection area on two previous days. Will this area be important? Of course. No-brainer. But will you short a move up to it, or look to trade a breakout above it? This is where our (or your) commentary comes in. What is going on in the world, news, correlated markets, volume, weather, holiday schedule, etc.? Your best guess as to how this all fits together is how you will hypothesize what you expect will happen and decide what you will do when price gets there. Then you will carefully watch order flow and if it confirms what you expect trade in your chosen direction. It is really quite elegant and simple. You have to pick a side and have an opinion.

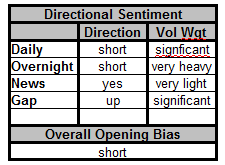
Sentiment Section:
-This section contains a few key items we use for handicapping reaction at key levels. Each item is a section of time from the big picture of what is going on from a daily perspective all the way down to how the market reacted to 8:30 news, if any.
-We do NOT make attempt nor care to predict direction, but rather to have a sense of what the general pressures on the market are in order to determine the likelihood a key level we are trading will hold or fail. Our analysis here is based 100% on volume, market internals & discretion, not rigid patterns.
-It is broken down by daily, overnight, news, & gap volume with an assessment of how MUCH volume in that direction there is relative to what is typical for the period. The idea being that we can assess the overall commitment of traders which if significant will place upward or downward pressures on the market at key levels.
-For example, if overnight volume was to the short side and the institutional order shorts represented 70% of their portion of the volume which was also twice the usual volume for the time period, that may signal that position traders are shifting down. If the daily volume over the last few days showed a similar pattern, this is even more powerful. Now imagine there was lots of short volume after a news announcement as well. When the cash market opens and the futures trade down to test the overnight low will you be extra cautious? Not fade it at all because down side pressure may be big enough to break the market down making that not a very high probability trade? You get the picture. There is never one answer, but you need to know and analyze this stuff. Something to remember about volume analysis. Volume is the truth. It is what really shows the market for what it is and no move is really important without it. It shows commitment of traders. period. And just because bars are moving up or down doesn’t mean any volume is trading in them. Any trend with low volume is suspect and any range with high volume to one side is a potential leading indicator. Don’t think of bias as predicting direction. Think of it as handicapping which levels you think are most likely to hold or break. If the overnight low is a trade you are considering fading (going long when price falls into it), if you have a short bias you might want to consider passing on the trade or just scalping it as there are underlying downward pressures on the market. But if you had a long side bias, that means you think the lows are more likely to hold so you can feel better about trading back into the range for a bigger distance.

Potential Trade Section:
-These sections identify the potential trades we are looking at for the morning session.
-We are not saying these will happen, just that if price gets there we will be watching order flow and potentially trading if everything reacts as we expect.
-We are prepared to change our mind about trading or in which direction at the last minute, but we have come to trust our choices and chances are, we WILL be trading one or more of them every day.
-Instead of waiting for the market to produce some pattern or a bunch of indicators to line up, typical professional short term traders trade price itself.
-It is also a natural and easy way to prevent over trading as it forces you to identify just a few low risk, high probability trades each day which you know ahead of time.
-IMPORTANT: Our levels are almost always very close in terms of identifying where the “fights” between sellers and buyers will occur, but are never meant to be exact. Many times they are – to the tick, but the idea is to time entry based on order flow and realize that the rotation may fall a little short or even probe past the level. You have to watch the order flow and just know that price will probably stall at least temporarily somewhere near these levels. All we know is that these levels have been previously important areas of high or low acceptance or rejection as shown by commitment of traders (volume). We don’t need to know any more. We just need to watch price and trade in the direction we expect price to move based on our complete analysis.
-A “fade” means that price moves up or down to a key level and we are betting it will reject there and rotate in the other direction. A “break”, means we will look to trade a breakout or breakdown in the direction of the current trend at that level. We rarely trade the breakouts and trade far more fade trades. Fades generally allow for far less risk and in the ES, contrarian trades are higher probability as they suit the ES market characteristics better. The ES is NOT a particularly good trending market in our view. Occasionally, we will write scalp in the box, which generally means that if we trade it we will be very careful and most likely just try to capture 1-3 ticks from the volatility as opposed to targeting a key level.
-There are up to two potential targets for each trade. We normally just trade to the first one, but no doubt some readers will trade for larger profits and we do occasionally trade for additional targets when the market is really moving.
-Again, we can’t stress enough that these levels are not absolute. But they are the most accurate anyone could ever come up with. Previous volume is truth and is all we have to go on other than discretion and fundamental analysis of the bigger picture. When we do enter, we are managing each trade carefully and discretion is of key importance. Our target levels are also very likely to be accurate as previous acceptance areas are magnets for price, but we are always ready to hop out and take profits or accept a smaller loss if the trade moves against us. There are no absolutes in discretionary intraday trading.

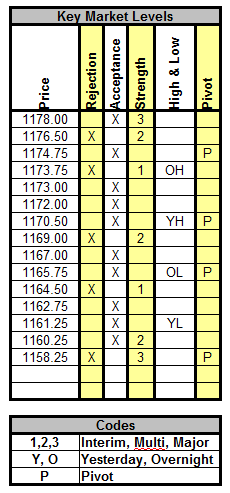
Key Market Levels Section:
-Each price is taken directly from our assessment of volume at price filtered by discretion. As in the trade identification columns these are NOT absolute levels. Just our best guess where price will be either accepted or rejected because it has been previously. Until price is accepted as fair value by both buyers and sellers it will run out of supply and be rejected whether it is an unfair low or unfair high.
-Professionals refer to this supply related reaction as responsive buying or responsive selling. Trade entries can be in either direction and will be identified specifically in the potential trade section to the left. Generally speaking rejection areas are trade entries for us, although sometimes we will enter at an acceptance area as well. Once in a trade we like to target acceptance areas which are the opposite of rejection. These are areas that have previously traded with a lot of volume. “Comfort” areas where both buyers and sellers have previously agreed on value.
-The main function of the price ladder is to identify all key high and low volume prices likely to be encountered in the first hour of trading only. Each price is either a nearby volume high or low, overnight or previous session high or low, and/or floor trader pivot point. Many times the prices we list will end up covering the whole day, but we generally only trade once or maybe twice in the first hour in a typical day so we really only try to put up the levels that could be hit during that time with a bit of cushion for wild conditions.
-Regarding the pivots, we are old school and have used them since the old floor days. Though just silly math calculations that have no real meaning in terms of traded volume, etc., they have an uncanny way of curve fitting themselves to price and price action so we still look at them. Lots of traders still look at them too and the market WILL react to them. Of course when the market does react, nine times out of ten it will also be because there is a key volume area there also, but the pivot ends up being a bonus. In fact, this is a way that we frequently add confidence to a handicapped trade. If a price is a key rejection area and happens to be the daily R1/S1 or R2/S2 they tend to be even more powerful. Not as absolutes but it is nice to know when they “agree” with a key level we already identified.
-We also assign a strength level to each potential trade levels in order to handicap the odds of it holding or giving way, which of course can affect outcomes. “3” levels are generally REALLY major levels in an intraday sense which are likely to be interim highs and lows, important even numbers, etc. “2” levels are also very strong and likely to be important levels in a longer term or composite time frame sense. “1” levels are usually overnight or yesterday highs and lows that don’t have other pressures adding to them.
-As an entry/target example consider the following levels from the chart section below, if we shorted 1187.25, we might target 1186.75 or even trade on to 1185.50 depending on objectives and market conditions. Notice that 87.25 is a rejection area and 86.75 and 85.50 are acceptance areas.

Putting it all together:
-A very popular question is how do we put all this together? It is really quite simple and intuitive. Analysis starts with identifying a level you are considering trading today. First you will look at the level and confirm it is a rejection area. Then you will study strength and other factors such as whether it is a previous high/low or pivot and based on the overall sentiment, decide how you want to trade it. If a level was particularly strong and was also a high/low pivot you might feel even better about the trade. Once in you would pick the next acceptance (or rejection) level to use as a potential target or guide for your trade. If you are in and know where the next rejection area is, you will probably want to consider coming out before you get there as if you get the typical responsive activity there it may eat into your profits. The reason we have so many levels close together is to give options on trades. Any level that is not your entry level can be used as a trade targeting guideline. Beyond those, other entry levels may also be used as targets.
Sorry, the comment form is closed at this time.